
Welcome to the Campus Chiller Plant
Want to check out an interactive tour of the plant?
-
Download the Metaverse App
-
Scan the QR code!

Campus Chiller Plant

The campus chiller plant joined a strategic plan called “The Illinois Climate Action Plan” (iCAP) which is targeting the goal of achieving carbon-neutral for the University of Illinois at Urbana-Champaign. The chiller plant has a couple of projects to sharpen its water management efficiency and to play a more friendly role to the environment. As the constant routine which the chiller plant went on well for years, it provides the cooling for many campus buildings and devices such as the Blue Waters supercomputer. In this project, we investigate some of the critical stages of the Oak Street Chiller Plant’s performance cycle.
Thermodynamic Processes of the
Vapor-Refrigeration Cycle
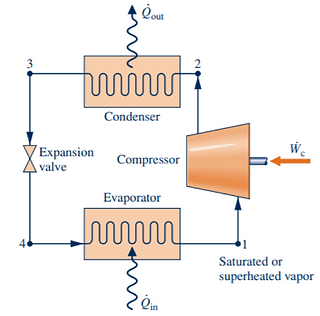
The Oak Street Chiller Plant follows the vapor refrigeration cycle, consisting of 4 key stages. These can be categorized into the compressor (process 1-2), condenser (process 2-3), expansion valve (process 3-4), and evaporator (process 4-1).
Campus Chiller Plant Analysis
Quantitative Analysis
The First Law of Thermodynamics that governs all thermodynamic processes is the change in internal energy of a system equal to the heat exchanged in a system minus the work performed on the system:
ΔH = Q - W
The following tables display the work performed on the system and the heat exchanged during each thermodynamic process mentioned above:
Metric
Imperial
Thermodynamic Process Calculations
The calculations performed to obtain to analyze the Campus Chiller Plant can be viewed on the following page!

Based on our calculations, we were able to determine the final Coefficient of Performance. To view some of operating parameters from this investigation, view the page below!
COP = 10.393
Discussion & Application
Reasoning & Discussion
Throughout this analysis of the vapor refrigeration cycle, we see the exchange of heat and work at specific points in the cyclical process of the vapor refrigeration cycle. From the results listed in the calculations, we can determine a final coefficient of performance (COP) to be 10.393. The coefficient of performance will indicate the level of efficiency of the system.
The four critical stages in the vapor refrigeration cycle utilize the compressor, condenser, expansion valve, and evaporator. Upon tackling calculations for the Chiller Plant, we assumed an ideal system. However, we did keep in mind that because we are using raw data provided from the Chiller Plant, we will encounter discrepancies and error due to inefficiency and inaccuracies in the true system. Following thermodynamic theory through each step in calculation, there is indeed some variation in the data used from the campus chiller plant and that thought to be ideal. This was expected as although a perfect closed system, this is not always the case with large, operating equipment and systems.
Coefficient of Performance Interpretation
Throughout this analysis of the vapor refrigeration cycle, we see the exchange of heat and work at specific points in the cyclical process. From the results shown in our calculations, we determined the final coefficient of performance (COP) to be 10.393. The coefficient of performance indicates the level of efficiency of the system. The higher the coefficient of performance, the more efficient the system is.
Cooling Capacity
The vapor-compression cycle is used to chill a desired medium, such as cooling water via the Oak Street Campus Chiller Plant. The cooling capacity of a system is the ability to remove heat from the system. The Oak Street Chiller Plant’s cooling capacity is 97.058 MW. This is determined via the calculations below.
1 ton cooling capacity = 12 kBtu/h ≈ 3.516 kW
Oak Street Campus Chiller Plant
27598 ton cooling capacity = 331.176 MBtu/hr ≈ 97.058 MW
Effect of Chill Water Storage on COP
What is the effect of chilled water storage on COP when rejecting heat to the cooling tower water that is slightly cooler at night?
Finding Flow Rates of Chilled Water, Cooling Tower Water and Refrigerant 134a
Chilled Water Mass Flow Rate
Data Sheet 3 → Vin at (4) for chilled water: 2010 GPM
(2010 gal/min)*(1 min/60 sec)*(0.00378541 m^3/1 gal)*(997 kg/1 m^3)
= 126.43 kg/s = 278.73 lb/s
Refrigerant 134a Mass Flow Rate
Assume heat transfer between chilled water and refrigerant is 100%
(Obviously not true, but for the sake of simplifying calculations)
First Law of Open Systems: Q41,rate = (m-dotCHW)*(Δh) = (m-dotR-134a)(h41)
Since this is done at constant pressure, okay to use: Δh = cp*ΔT
In evaporator, chilled water goes from 52.6°F to 41.1°F → 278.21K to 278.21K → ΔT = 6.38 K
cp interpolation: (4.179-4.211)/(300-275) = (cp-4.211)/(281.4-275)→ cp = 4.203 kJ/(kg*K)
Heat transfer between water and refrigerant:
Q41, rate = (126.43 kg/s)*(4.203kJ/(kg*K))(6.38 K) = (m-dotR-134a)(165.017 kJ/kg)
→ 20.545 kg/s = 45.29 lb/s
Cooling Tower Water Mass Flow Rate
Data Sheet 3 → Vin at (2) for cooling tower water = 3611 GPM
(3611 gal/min)*(1 min/60 sec)*(0.00378541 m^3/1 gal)*(997 kg/1 m^3)
= 227.14 kg/s = 500.76 lb/s
Accounting for Cooling Tower Effect
Temperature of water goes down as it goes through the tower.
Data Sheet 4: Water goes from 84.8°F to 76.7°F → 302.48K to 297.98K → ΔT = 4.5 K
cp interpolation is not worth doing, since around Tavg is around 300 K (cp = 4.179kJ/kg*K)
Q= (224.17 kg/s)*(4.179kJkg*K)*(4.5 K) = 4,271.48 kW
ηcooling tower = (71.2 kW)*(4271.48 kW) = 1.67% efficiency (what a waste!)
Data Sheet 2: Condenser liquid goes from 76.4°F to 84.1°F → 297.82 K to 302.09 K
ΔT = 4.27 K
Once again, cp interpolation is not worth doing, since around Tavg ~ 300 K
(cp = 4.179kJ/kg*K)
Q23,rate = (m-dotcooling tower)*(Δh) = (m-dotR-134a)(h23,new) →
(227.14 kg/s)*(4.179kJkg*K)(4.27 K) = (20.545 kg/s)(h23,new)
h23,new = 197.282 kJ/kg = 84.82 Btu/lb
h2 - h23,new = 265.975 - 197.282 = 68.693 kJ/kg = h3 = hf
h3 = h4 = 68.693 kJ/kg = 29.53 Btu/lb
p4 = 36 psi = 2.482 bar
Interpolation: (-1.23+5.37)/(2.8-2.4) = (T4+5.37)/(2.482-2.4)→ T4 = -4.52°C, 23.9°F
(This is around the average minimum temperature for the winter time in Champaign, which is -7.7°C, 18.1°F. This is definitely possible during the night time.)
q41 = 250.098 - 68.693 = 181.405 kJ/kg = 77.99 Btu/lb
Original COPR = 10.393
Calculated Cooling Tower COPR = (q41)/(w12)= (181.405)/(15.877) = 11.43
Actual Cooling Tower COPR = (Q41,rate+Qturbine, rate)/(W12)
= (3390.27 kW+71.2 kW)/(326.19 kW) = 10.61
By accounting for the cooling tower, the COP of the cycle increases. Unfortunately, the actual increase in COP due to the cooling tower is much less than what was calculated. This may have to do with the fact that the cooling towers are very large in size and do have a considerable amount of piping in them. This may also have to do with the gargantuan size of the chiller water tank, which holds millions of gallons at a time. Effective heat transfer through the liquid will most likely not be possible under those circumstances.
Comparison of Quantitative Values and
Theoretical Data Sheets
In comparison with the data from the chiller plant, this analysis is closely representative of the cycle at each of its main points. With this thermodynamic analysis it is expected that there are forces that we cannot perfectly calculate such as fluid frictional forces on the working fluids or heat lost to the surroundings. The loss of heat to surroundings can occur in many components of this cycle. Heat losses however are more variable to the temperature of the outside ambient air. These two factors are expected to be where differences arise. The cooling capacity maximum was calculated to be 4,220.3 kW, where the actual cooling capacity was found to be 3390.27 kW. The actual value was lower than the original predicted value meaning the chiller is operating somewhere around 80% of its potential efficiency. To operate the compressor, the predicted input that was calculated was 326.193 kW in an ideal situation. The actual power the chillers required for operation was 629.47 kW. Lastly, in calculation of COP from general calculation the result was 10.393, compared to the value of COP calculated from the data sheet #1 values, being 5.39, it is seen that the actual COP is lower than first calculated. From this, it is understood that the values computed in our analysis are higher than that of the actual output of the chillers due to the lack of account for fluid frictional forces within pipelines and heat loss to the environment.
Coefficient of Performance
Calculated COP from calculations = 10.393
Data Sheet #1: Chiller has 0.653 kW/Ton
1 kW/Ton = 3.517/(COP_R) → COP_R = 3.517/(.653)= 5.39
Cooling Load/Maximum Cooling Capacity
Calculated Mass Flow Rate of Refrigerant 134a: 20.545 kg/s
Cooling Load (Actual): (20.545)*(165.017) = 3390.27 kW = 11.57 MBtu/hr
Cooling Capacity (Maximum): 4,220.3 kW = 14.4 MBtu/hr
(The chiller is operating at about ~80% capacity)
Compressor Power
Required power(ideal): (20.545 kg/s)(15.877 kJ/kg) = 326.193 kW = 11.1 MBtu/hr
Actual power (Data Sheet 1): Based on COP given, w12 = 629.47 kW = 2.15 MBtu/hr
Environmental Impact
How many tons of coal per year is needed for the input power of the chiller plant? What is the annual production of CO2?
According to a few sources from iCAP, there have been attempts at reducing the overall waste level of water at the different plants at the University of Illinois. Because of this, it is reasonable to believe that these waste levels for coal and other chemicals have been reduced as well due to this shift. Furthermore, the plant has made efforts to clean out the impurities in its pipes using an innovative process whereby beads are put through the pipes to knock off any residue on the interior. This new way of cleaning is much more efficient, as the cycle can still run without it. It is difficult to compare the average amount of coal use by the Oak Street Chiller Plant to other chiller plants around the world due to various duties and the differences in the amount of coolant demanded from them. For the sake of brevity, it is good to note that the annual amount of tons of chemicals such as SO2 and NOx used are much lower than the tons of coal that are used. There is the question, however, of whether or not to use electricity to power these turbines, as using the electrical grid may allow for more efficient power to be produced and used. Nevertheless, the coal is a useful basis of comparison amongst other chiller plants that may use the same power source.
Knowns
W = 15.877 kJ/kg
Mass Flow Rate = 725.85 kg/s =1600.2 lb/s
Calculations
P = W*Mass Flow Rate = 11524.32 kJ/s
t = 1 year = (365 days)*(24 hours)*(60 minutes)*(60 seconds) = 3153600 seconds
Q = P*t = 3.6343*10^5 GJ = 3.4446*10^5 MBtu
1 Ton of Coal Produces 25GJ
Mass of the Coal = Q/25GJ = 14537.20 metric tons = 14307.60 US tons
Average pounds of CO2 per MBTU = 216 lbs/BTU
m(CO2) = Q*216 = 7.4403*10^7 lbs = 33,748.63 metric tons or 33,215.62 imperial tons
The chiller plant produces 33,748.63 metric tons or 33,215.62 imperial tons of CO2 per year.
References
Data sheet 3 - Total Chiller Flow
Taken from Midterm 2
https://www.eia.gov/tools/faqs/faq.php?id=73&t=11
97.058 MW
33,748.63 Tons CO2 Pollutants
COPR, Original = 10.393
COPR, Calculated Cooling Tower = 11.43
COPR, Actual Cooling Tower = 10.61


NOTICE: Any copyrighted material used within this website is done so under the Fair Use agreement. This website was devised and developed by the authors Hannah Hawkinson, Christopher Metellus, Arielle Pfeil, Selin Sipahi, and Zheyu Zhou as part of a team project in Thermodynamics (ME 200) at the University of Illinois at Urbana-Champaign (UIUC). The course instructor was Prof. Leon Liebenberg, leonl@illinois.edu